Infrared spectrometry

How does IR spectrometry work?

Drone IR spectrometry measures the infrared absorption of an object. By determining which frequencies have been absorbed, it is possible to determine which chemical bonds occur in the measuring object. The percentage of light reflected from the measurement object is displayed as a graph, called an infrared spectrum. An infrared spectrum is a representation of the frequencies of the absorbed infrared light. By using this spectrum it is possible to analyze which chemical compounds occur in the object of investigation.

Application of Drone IR spectometry

  • Oil and gas exploration
  • Mining
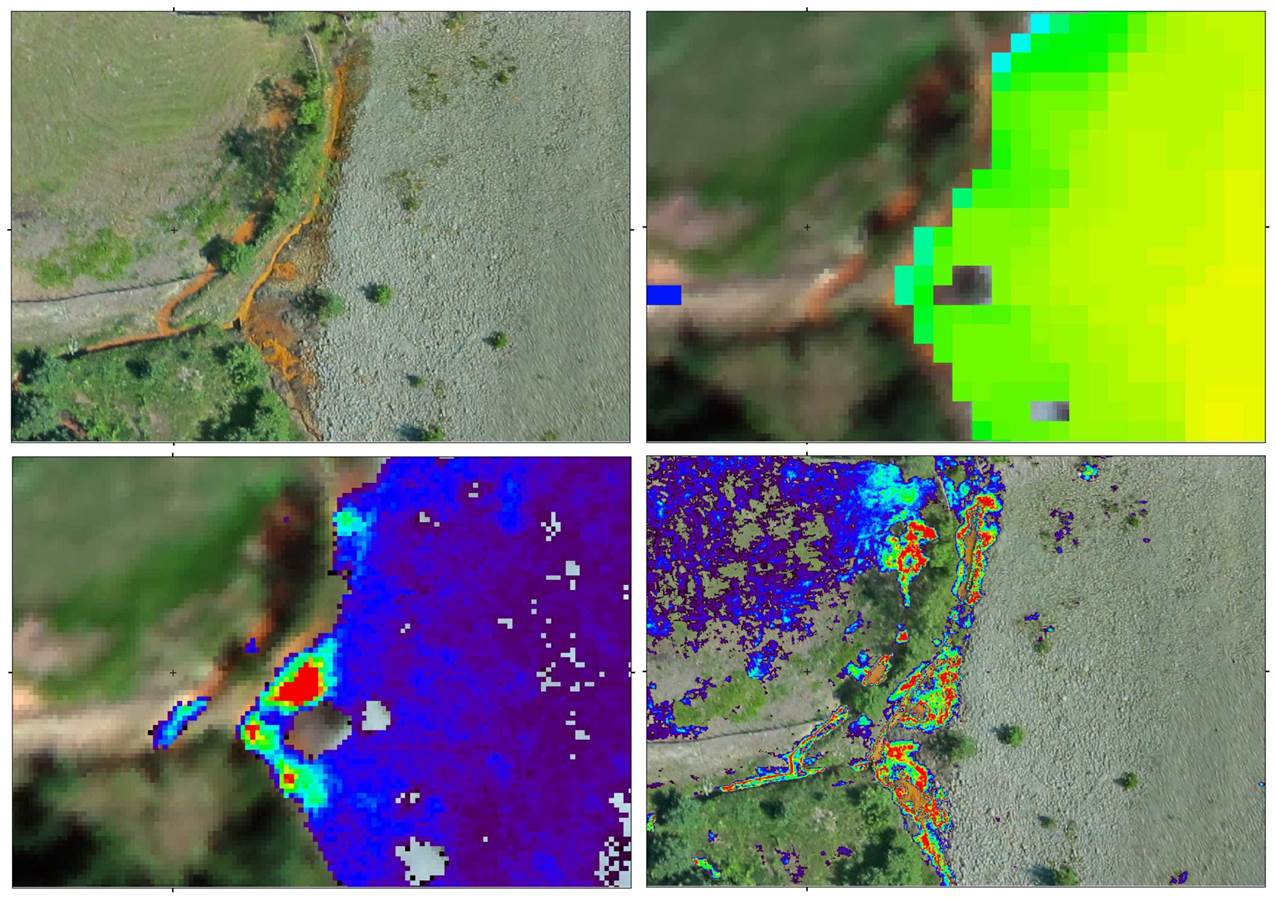
  • Environmental research: determining the chemical composition of ore deposits, reservoir rocks and substances that pollute the soil
  • Agriculture: early detection of crop diseases
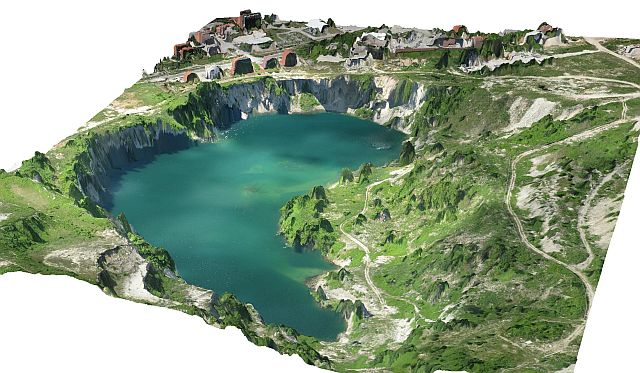
The Vihovici coal mine is located in the heavily industrialized Mostar Valley, Bosnia and Herzegovina. The mine was exploited by a state-owned company, but has been inactive since 1991.  

As part of the EU-FP7 IMPACTMIN study, this area was investigated using a combination of remote sensing data (Satellite imagery, UAV technology, airborne hyperspectral imagery, gammaray data) and a variety of field data, including spectral measurements on soils and rocks.  

The area exhibits in many ways very high levels of risk to the environment and local population. The aim of the study was:    

  1. Monitoring the stability of the pit-wall.
  2. Detection and delineation of underground coal fires which can spread to the dumpsites or cause chemical reactions producing hazardous gases. The burning of the coal also destabilizes the steep slopes even more. 
  3. Delineation of the horizontal and vertical extend of the landfill. The mine was used as public solid waste dump during the 1992-1995 war. Illegal waste dumping still continues. There are  reports of radioactive waste dumped in the area before, during and after the war. 
  4. Inspection of sewerage and discharge systems, wich are generally in poor conditions.
  5. Determination of the grade and extend of soil and groundwater pollution. Waterborne pollutants are a serious concern for the environment and public health.   
  6. Detection and delineation of other landfills in the vicinity of the mine. Large quantities of waste are reportedly being dumped illegally at roadsides, rivers, abandoned mines (including Vihovici), posing a threat to public health and the environment.

Top: 3-D model of the Vihovici open pit mine
Middle: Digital elevation model of the Vihovici open pit area
Bottom:
Example of spectral mapping of polluted soils. The inset shows some examples of reflectance spectra of soils at different locations. The numbers refer to the sample locations on the image.


The Rosia Montana Goldmine,  located in the so-called “Golden Quadrilateral” in the Apuseni  Mountains, Western Romania, has been an active gold mine since Roman times. Currently the mine is inactive but previous mining activities have left deep environmental scars. Recent plans to reopen the mine have sparked intense protests amongst national and international organisations.  If realized, Rosia Montana would become Europe’s largest open pit gold mine, and this would have a devastating  impact on the local environment. 

As part of the EU-FP7 IMPACTMIN study subsidized by the European Commission, this area was surveyed using a combination of remote sensing data (Satellite imagery, UAV technology, airborne hyperspectral  imagery, gammaray data) and a variety of field data, including a detailed spectral study of soil, rocks and vegetation.  

The combined remote sensing data were used to characterize:

  • The open pit area: mineralogy, geochemistry, geomorphology
  • The tailings dam area: Mineralogy, geochemistry, tailings dispersal into einvironment
  • The acid drainage from the mine and the tailings dam.
  • The acid generating/buffering potential of various geologic formations in the area.
  • Condition of soils, farmland and forest areas: soil mineralogy and vegetation stress.  

Middle right: Acid mine drainage with pH<1, running off into the local surface water system.
 

Mapping of Acid drainage related secondary iron minerals by:

Top left: Smartplanes natural color image
Top right: Worldview 2 satellite image, resolution 50 cm

Bottom left: Hyperspectral images from manned aircraft, resolution 50 cm 
Bottom right: Drone aerial photograph, resolution 5 cm